When to use to to Autel Maxisys Ultra Live Data, the screen displays the data list for the selected module. The parameters display in the order that they are transmitted by the ECU, so expect variation among vehicles.
Gesture scrolling allows you to quickly move through the data list. Touch the screen and drag your finger up or down to reposition the parameters being displayed if the data occupies more than one screen. The figure below displays a typical Live Data screen:
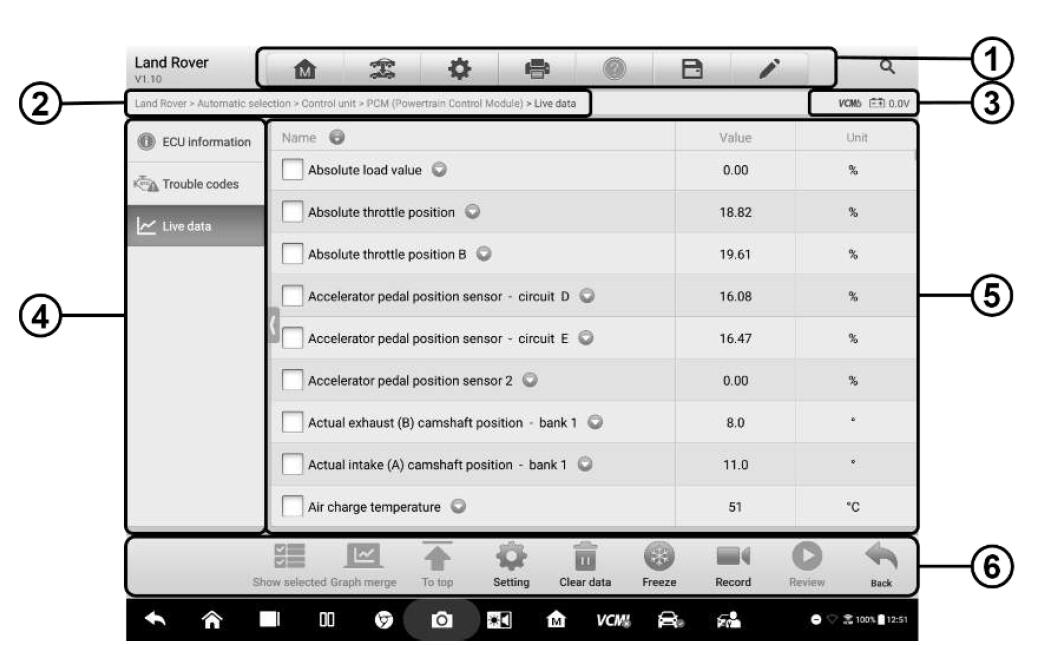
1. Diagnostics Toolbar Buttons
2. Current Directory Path
3. Status Information Bar
4. Navigation Bar
5. Main Section
* Name Column – this column displays the parameter names.
a) Check Box – tap the check box to the left of a parameter name to select the item. Tap the check box again to deselect it.
b) Drop-down Button – tap the drop-down button on the right side of the parameter name to open a submenu that provides optional modes in which to display the data.
* Value Column – displays the values of the parameter items.
* Unit Column – displays the unit for the parameter values.
To change the Unit mode, tap the Setting button in the top toolbar and select a required mode. See Unit on page 254.
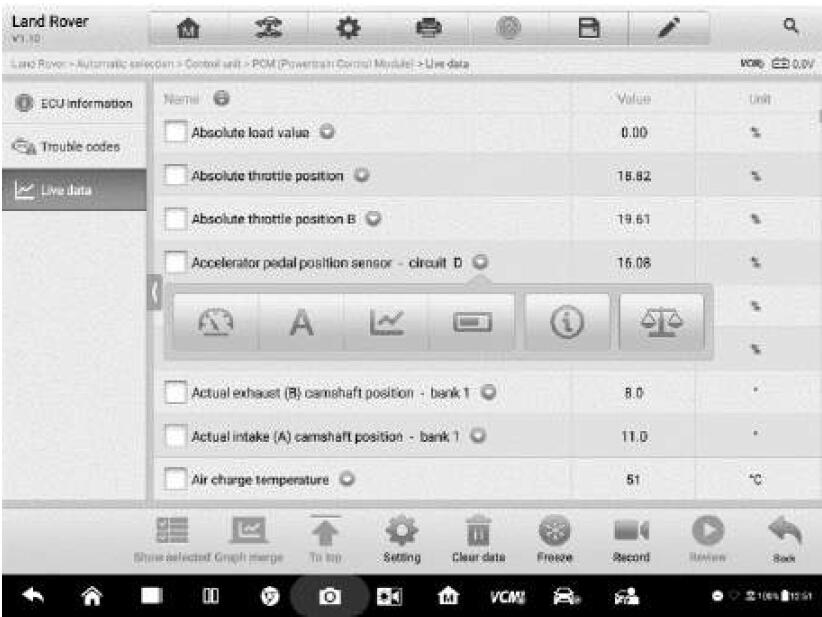
Display Mode
There are four types of display modes available for data viewing, allowing you to view various types of parameters in the mode best suited to represent the data.
Tap the drop-down button on the right side of the parameter name to open a submenu. A total of 6 buttons will be displayed: The 4 buttons to the left represent different data display modes, plus one Information button, active when additional information is available, and one Unit Change button, for switching the unit of displayed data, to the right.

Each parameter item displays the selected mode independently.
* Analog Gauge Mode – displays the parameters in gauge charts.
* Text Mode – the default mode that displays the parameters as a text list.
NOTE:
Status parameters, such as a switch reading like ON, OFF, ACTIVE, and ABORT can only be displayed in Text Mode. Value parameters, such as a sensor reading, can be displayed in both text and graph modes.
Waveform Graph Mode – displays the parameters in waveform graphs. In this mode, five control buttons will display on the right side of the parameter item, allowing you to manipulate the display status.\

1) Settings Button (SetY) – sets the minimum and maximum value of the Y axis.
2) Scale Button – changes the scale values.
There are two scale buttons, displayed above the waveform graph to the right side, which can be used to change the scale values of the X axis and Y axis of the graph. There are four scales available: x1, x2, x4 and x8.
3) Edit Button – edit the waveform color and the line thickness.
4) Text Button – resumes Text Display Mode.
5) Zoom-in Button – tap once to display the selected data graph in full screen.
Full Screen Display – this option is only available in the waveform graph mode, and mostly used in Graph Merge status for data comparison. There are four control buttons available on the top right side of the screen under this mode.
* Scale Button – tap to change the scale values below the waveform graph. There are four scales available: x1, x2, x4 and x8.
* Edit Button – tap to open an edit window, in which you can set the waveform color and the line thickness displayed for the selected parameter item.
* Text Button – resumes Text Display Mode.
* Zoom-out Button – tap to exit full screen display.
To edit the waveform color and line thickness in a data graph
1. Select parameter items to display in Waveform Graph mode.
2. Tap the Edit Button, and an edit window displays.

3. The parameter item is selected automatically in the left column.
4. Select a color from the second column.
5. Select a line thickness from the right column.
6. Tap Done to save the setting and exit, or tap Cancel to exit without saving.
NOTE:
In full screen display, please edit the waveform color and line thickness by tapping the Edit Button on the top right side of the screen.
* Digital Gauge Mode – displays the parameters in the form of a digital gauge graph.
6. Functional Buttons
The operations of the available functional buttons on the Live Data screen are described below:
* Back – returns to the previous screen or exits the function.
* Record – starts recording the real-time live data on the current screen. If you need to record the live date on different screens, please select all the live data you need, and select the “Show selected”, then starts the recording. The recorded live data can be viewed in Review Data in the Data Manager application.
* Resume – this button displays when the Record or Freeze function is applied. Tap this button to stop data recording, or exit freeze data mode, and resumes normal data display mode.
Freeze – displays the retrieved data in freeze mode.
* Previous Frame – moves to the previous frame of frozen data.
* Next Frame – moves to the next frame of frozen data.
Clear Data – tap this button to clear all previously retrieved parameter values.
* To Top – moves a selected data item to the top of the list.
* Graph Merge – tap this button to merge selected data graphs (for Waveform Graph Mode only). This function is very useful when comparing different parameters.
NOTE:
This mode supports Graph Merge for 2 to 4 parameter items only. Select 2 or 4 parameters when creating a graph merge.
To cancel Graph Merge mode, tap the drop-down button on the right side of the parameter name, and select a data display mode.
* Show Selected/Show All – tap this button to switch between the two options; one displays the selected parameter items, the other displays all the available items.
* Setting – tap this button to open a setting screen to set the trigger mode, recording duration, and to set threshold values for data recording.
There are four navigation buttons at the top of the Setting mode screen.
* Selected Button – displays the configuration screen to set the threshold values, an upper limit and a lower limit, for triggering the buzzer alarm. This function is only applied to the Waveform Graph display mode.
a) MIN – tap this button to display a virtual keyboard to enter the required lower limit value.
b) MAX – tap this button to display a virtual keyboard to enter the required upper limit value.
c) Buzzer Alarm – switches the alarm on and off. The alarm function makes a beep sound as an alert when the data reading reaches the preset minimum or maximum point.
To set threshold limits for the parameter values
1. Tap the Setting button at the bottom of the Live Data screen.
2. Tap the Selected navigation button.
3. Select a parameter item from the left column, or enter the item name in the Search bar.
4. Tap the MIN button on the right side, and enter the required minimum value.
5. Tap the MAX button on the right side, and enter the required maximum value.
6. Tap the ON/OFF button on the right side of the Buzzer alarm button to turn it on or off.
7. Tap Done to save the setting and return to the Live Data screen; or tap Cancel to exit without saving.
When the limits are successfully set, two horizontal lines display on each of the data graphs (when Waveform Graph Mode is applied) to indicate the alarm point. The limit lines are shown in different colors for distinction from the parameter waveforms.
* Record – displays the configuration screen for Record Setting, where you can set the trigger type, duration and trigger point for the data recording function.
a) Trigger Type – sets the trigger mode for data recording. There are four options available:
1) Manual – allows you to manually start and stop data recording.
2) DTC – auto triggers data recording when any DTC is detected.
3) DTC Check Mode – auto triggers data recording when certain preselected DTC types are detected.
4) Parameter – auto triggers data recording when any parameter value reaches the preset threshold.
b) Duration – sets the recording time (for Auto trigger mode only).
c) Trigger Point – reserves a relative percentage of a record length before the data recording start point for reference (for Auto trigger mode only).
To perform setting for live data record
1. Tap the Setting functional button at the bottom of the Live Data screen.
2. Tap the Record navigation button.
3. Tap the button to the right of the Trigger Type bar and select the required trigger mode.
4. Tap the button to the right of the Duration bar and select a length of time.
5. Tap the button to the right of the Trigger Point bar and select a relative percentage of a record length to be reserved before the data recording start point.
6. Tap Done to save the setting and return to the Live Data screen; or tap Cancel to exit without saving.
* Done – confirms and saves the setting, and redirects you to the Live Data screen.
* Cancel – cancels the setting operation, and redirects you to the Live Data screen.
For more information about Autel Scan Tool ,please visit our website sale@cnautotool.com